Ink Splat Filter
January 16th, 2011
The Ink Splat Filter started with my QR Code Manipulator project, where I transformed a black and white pixelated image into one that had smooth corners, as if drawn with ink. I did that with a rather boring QR code image and wanted to adapt the code to work with any image.
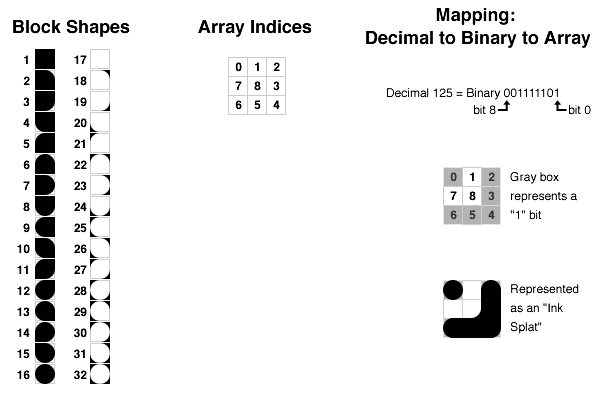
In order to create the ink splatter filter I had to identify all of the possible shapes that a single "block" could take on. The shape of each block is affected by its eight neighbors, which can either be black or white (binary), so I knew there were 28 (256) possible combinations of the eight neighbors. However, because of symmetry there are only 32 unique block shapes, and really only 16 true shapes because the other 16 are simply the same shape with the black and white parts inverted.
Besides the block shapes, this project has two other interesting facets. The first challenge was translating values in a one-dimensional linear array into a two-dimensional coordinate position. The second challenge was creating a test pattern of all 512 possible 3 x 3 black and white grids.
The Processing language often stores image data as a one-dimensional array that contains a color value for each pixel in the image, and whose length is the product of the image’s width and height. Translating an array value to its appropriate (x,y) coordinate position in two dimensions requires a little bit of math. The x position can be found by taking the modulos of the image width. The modulos operation calculates the "wrap around" value, which is found by taking the remainder of the array position, "i", divided by width. For example, 125 % 100 = 25, which means that the 125th linear array value will be in the 25th column of a 100-pixel wide image. Likewise, the one-dimensional array position 225 will also be in the 25th column (x = 25) position.
The y position of a one-dimensional array can be found by dividing the linear array position by the width of the image and round down to the nearest integer (this is the "floor" function in the Processing language). For example 125 / 100 = 1.25, rounded down to the nearest integer is 1, which corresponds to y = 1, meaning the 125th linear array position is located in row 1 (where the first row is row zero). By multiplying the x and y positions by a desired "spacing" value, it is possible to up-sample the x and y positions to any scale. See my Newsprint project for more on image sampling.
The second challenging of creating a test-pattern of every possible 3 x 3 black and white grid could sound intimidating at first because of the complication in drawing all of the patterns. The first trick was to realize that to loop through all of these patterns was as easy as looping from 0 to 511 and converting the decimal value of each iteration into its 9-digit binary equivalent. Then, by assigning each digit in the binary number to a position of the 3 x 3 grid, every possible grid pattern could be drawn!
The image at the top of this article is a filtered image, mixed with Jackson Pollock’s Number 8.
Media:
Images


